Getting Frame Data from Chrome Devtools for Devtools
I’ll let you in on a little secret: Chrome’s devtools are essentially just another webapp. This means that you can check out data from the devtools in another devtools instance.
Problem Statement
The reason this article came to be is that a current client of mine is developing a benchmark engine for our rendering code. As part of this, we want to see if the measurements line up (at least somewhat, it doesn’t have to be super accurate) with what we’re seeing when we take performance measurements manually through Chrome’s devtools.
Given a particular test case (say, “Create a note and type 20 characters into it”), we can measure performance of the webapp, including FPS, how long each frame took to render, a visual indicator of the frame, whether the frame was dropped, how many FPS the frame was running at, and the number of milliseconds each frame took to render.
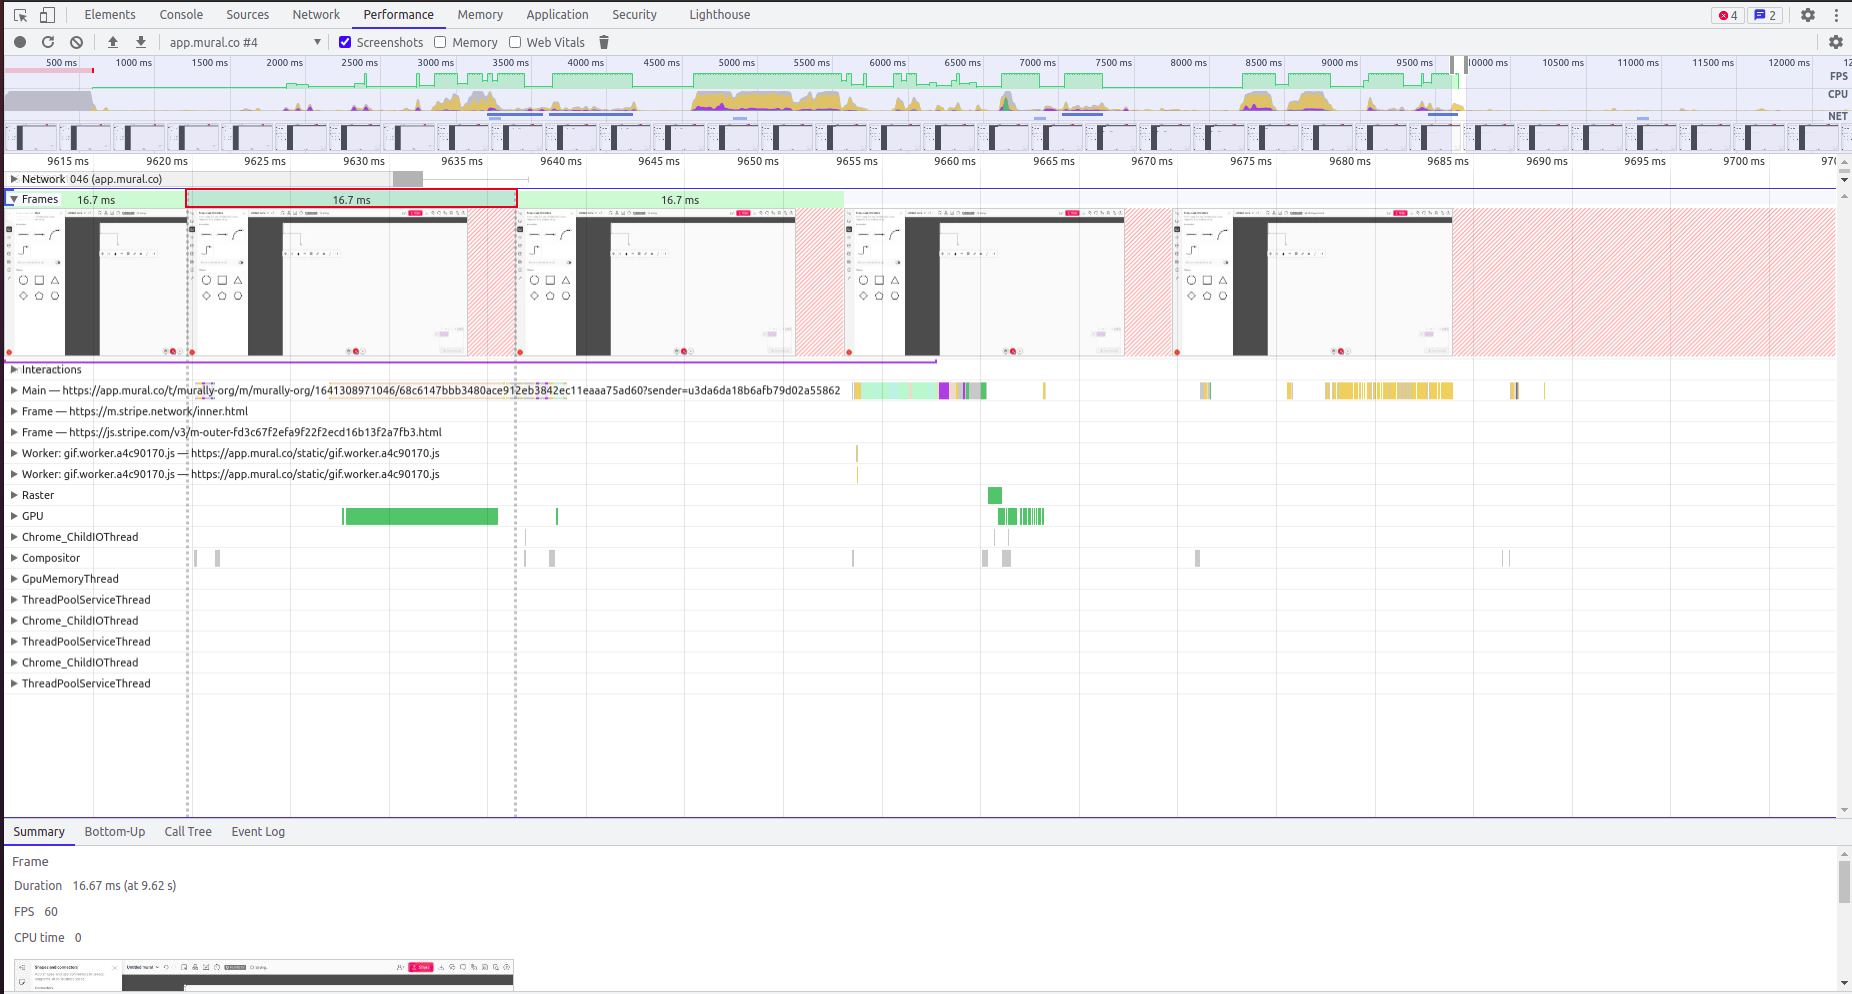
The problem with this view is that there isn’t any way to aggregate this data. In other words, if I want to put the number of frames as a value into a spreadsheet, I would have to manually click through and count the frames. I did this for one test case and quickly realized this wasn’t going to be an effective use of my time. What I want out of the data are the following data points for some set of frames between X and Y offset milliseconds (from the start of the recording):
- How many frames were rendered (we’ll include dropped frames here)?
- What the minimum FPS was across all frames?
- What the maximum FPS was across all frames?
- What the average FPS was across all frames?
DevTools for DevTools
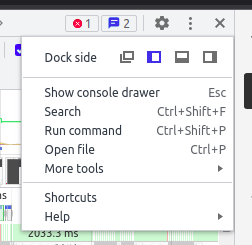
Since the Chrome developer tools are just another webapp, we can actually invoke the devtools on the devtools window. I break the devtools out into a separate window for convenience by pressing the three vertical dots icon in the upper right corner of the devtools and selecting “Dock Side: Undock into separate window” (the leftmost option):
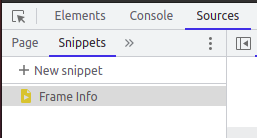
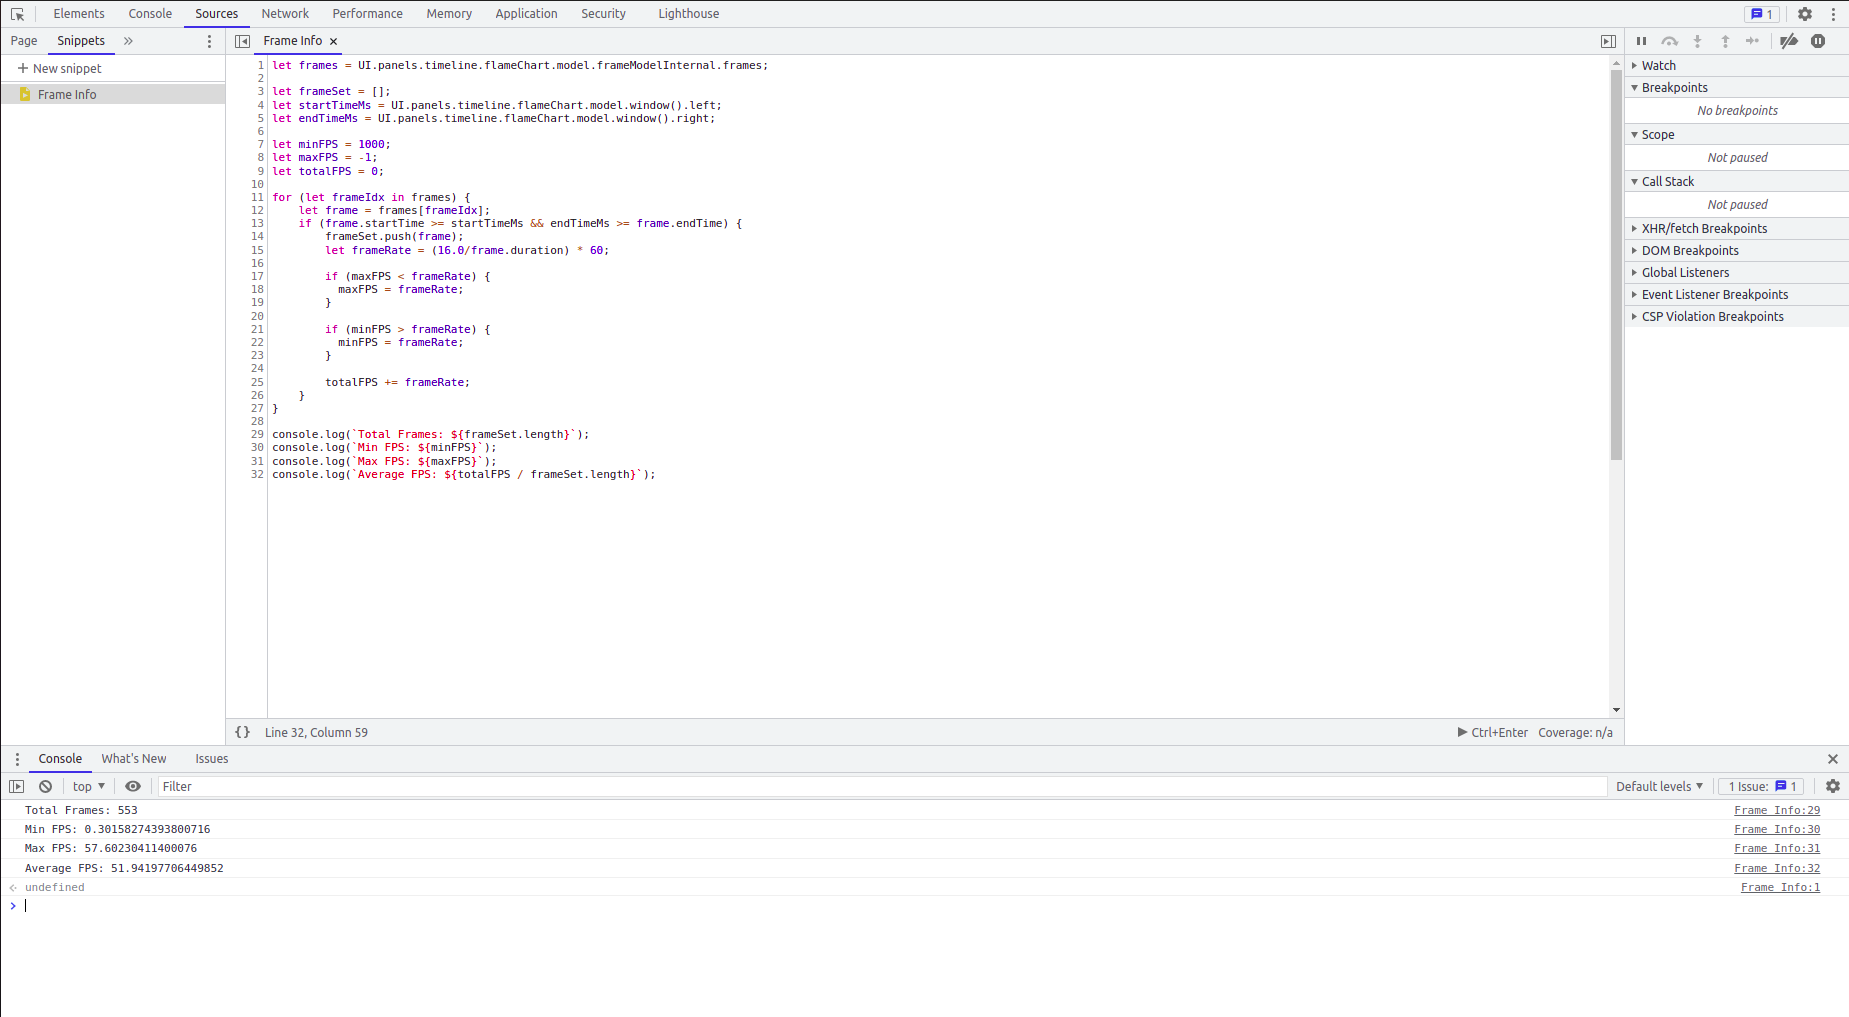
Now, from this devtools window, launch another devtools window using CTRL+SHIFT+i. From within this new devtools window, select the “Sources” tab from the top, and click the “Snippets” tab just below that in the upper right corner. Click the line that says “New snippet”. Name this snippet whatever you want. I’m named mine “Frame info”.
You’re going to put the following code into this snippet1:
let frames = UI.panels.timeline.flameChart.model.frameModelInternal.frames;

let frameSet = [];
let startTimeMs = UI.panels.timeline.flameChart.model.window().left;
let endTimeMs = UI.panels.timeline.flameChart.model.window().right;

let minFPS = 1000;
let maxFPS = -1;
let totalFPS = 0;

for (let frameIdx in frames) {
    let frame = frames[frameIdx];
    if (frame.startTime >= startTimeMs && endTimeMs >= frame.endTime) {
        frameSet.push(frame);
        let frameRate = (16.0/frame.duration) * 60;

        if (maxFPS < frameRate) {
          maxFPS = frameRate;
        }

        if (minFPS > frameRate) {
          minFPS = frameRate;
        }

        totalFPS += frameRate;
    }
}

console.log(`Total Frames: ${frameSet.length}`);
console.log(`Min FPS: ${minFPS}`);
console.log(`Max FPS: ${maxFPS}`);
console.log(`Average FPS: ${totalFPS / frameSet.length}`);
Note the startTimeMs and endTimeMs variables at the top. You’ll need to adjust the window of the
performance profile to encapsulate where the data you want is located. How to do this is discussed
in the next section.
Usage
Now that we have our snippet in the Chrome devtools-for-devtools, it’s time to use it to get the metrics we want. Here’s a brief list of steps to accomplish this2:
- Open up the original web application window and do anything you need to prepare for the performance capture session (e.g. log in, arrange whatever you need so that you can capture performance data of just what you want).
- Open up the “devtools1” window and click the “Performance” tab, then click the little record button in the upper left corner to start the performance recording session.
- Go back to the web app window and perform whatever you are looking to profile.
- Navigate back to the devtools1 window and stop the performance session. Wait for it to finish processing the profile.
- Find the start and end times (in ms) for the session (discussed in detail below).
- Click CTRL+Enter to run the snippet and output your data to the console log.
If these steps are performed successfully, you should see something like the following in your console log:

Finding the start and end times
You can just use a startTimeMs of 0 and an endTimeMs of whatever the length of your profile
was, in milliseconds (which is the default), but, it’s often the case that you take a long profile
and don’t really want all of the data. A reason for this might be that you spend a second or two at
the beginning fiddling around before what you actually want to track, or perhaps you get interrupted
at the very end of your profile by your wife bringing you coffee and forget to stop the profile
right away.
In these cases, I’ve found one way to tell where the “real” profile starts and ends is to take a look at the “Frames” section of the profile and highlight a window to bound the profile. In the following image, I can see, from the frame images, that the task I’m looking to complete doesn’t actually start until about 1830ms:
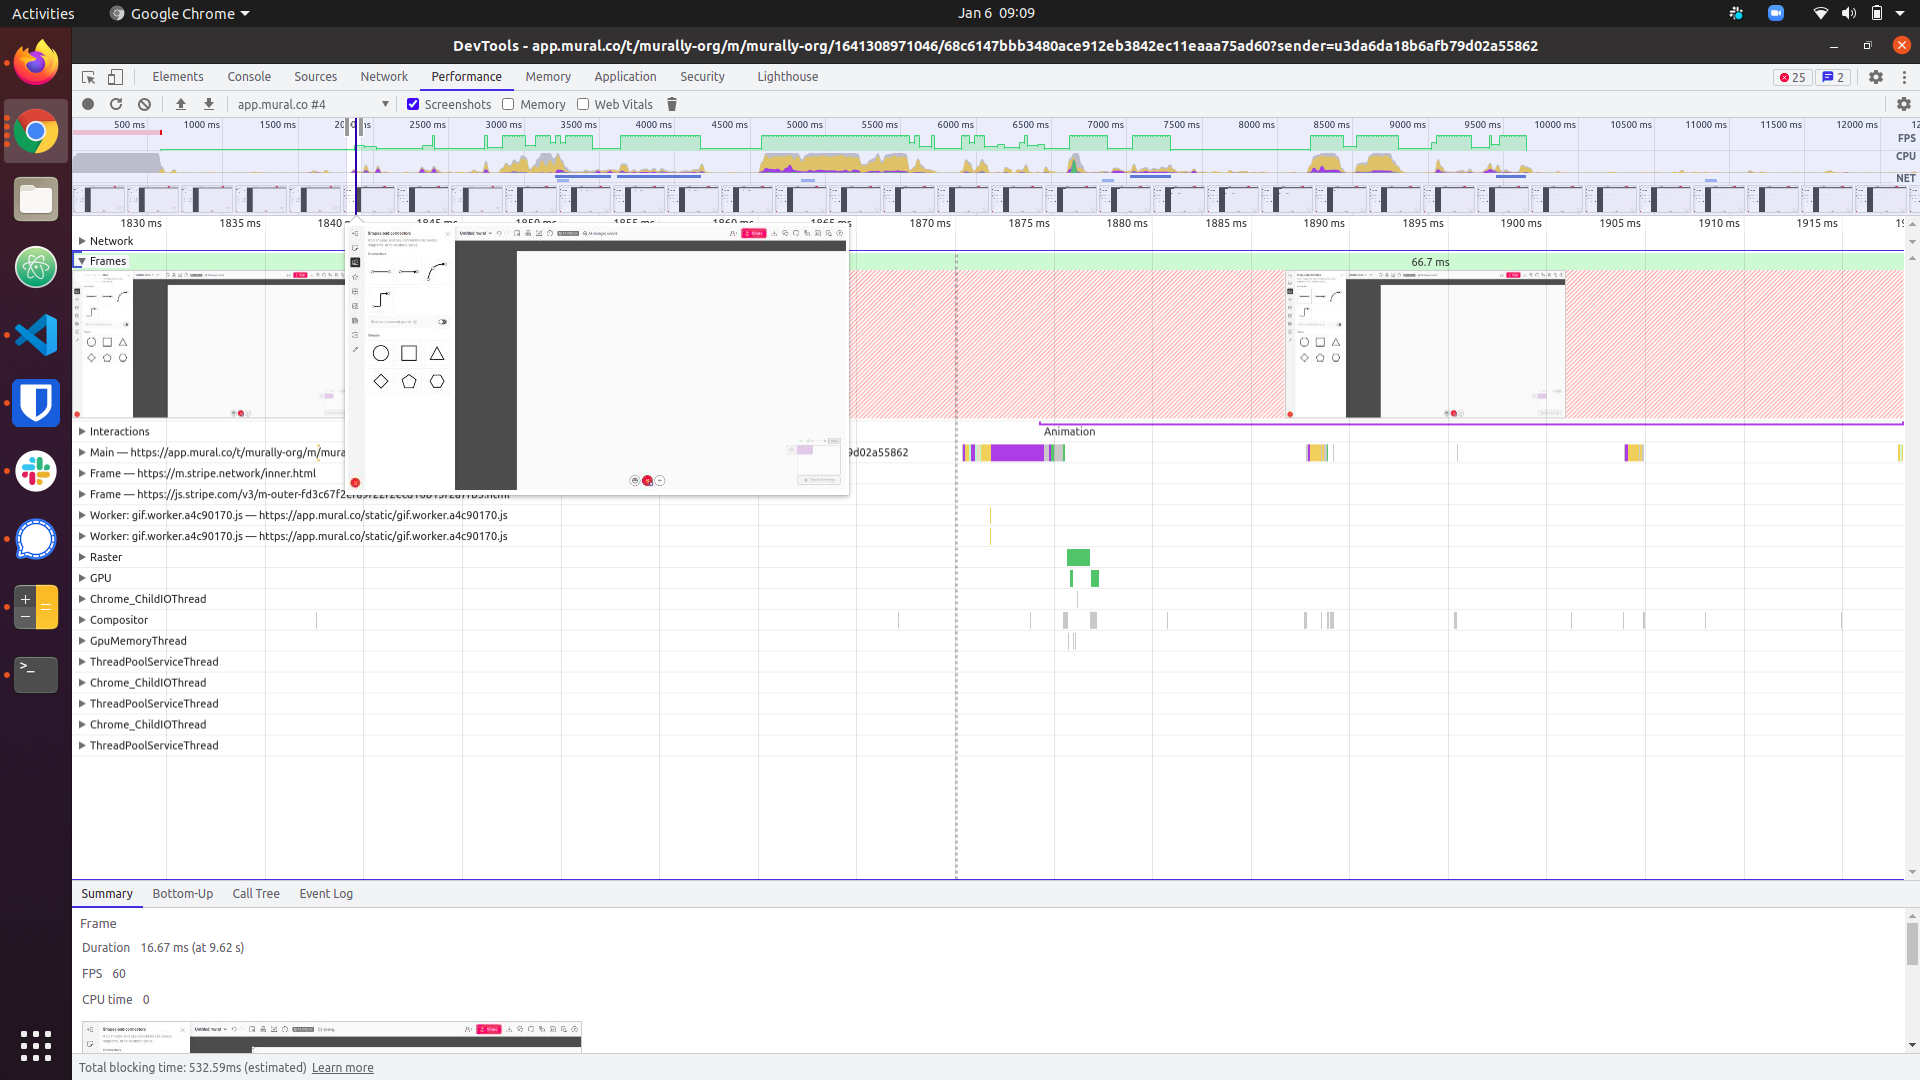
You can click and drag on either end of the window (sometimes the little handles are difficult to see) to adjust what is included in the window. Once you adjust the window, you can go back to the script view and run the script to get the data you want.
Conclusion
Hopefully, this gave you a decent introduction into how to use devtools for devtools to glean FPS
and frame statistics from a performance profile. There are other things you can do with the UI
data structure, so experiment! Getting frame statistics is just the tip of the iceberg, so feel free
to write in the comments any useful snippets for your work.
Footnotes
-
I got most of this code thanks to this StackOverflow post, but it’s been edited a bit. The API for the devtools-for-devtools doesn’t seem to be quite the same as it was when that post was written. ↩
-
For brevity, I’m going to stop referring to ‘devtools-for-devtools’ and instead refer to ‘devtools1’ as the devtools window we originally opened on our web application we wanted to take readings for and ‘devtools2’ as the devtools-for-devtools window we opened last. ↩
Subscribe to The Nothingness of Scott
Get the latest posts delivered right to your inbox